Tool #5: Easel.ly

Tool: Easel.ly

Cost: Free!

Link: http://www.easel.ly

What is it? Easil.ly is an awesome tool that allows you to create your own infographics.  Infographics, according to the dictionary, are “visual images such as charts or diagrams used to represent information or data.”  This type of tool could be used in virtually any subject area, but check out how a teacher used it for reading assessment!

What do I need to do? Login was ridiculously easy; all it requires is a quick registration.

Want to check one out? Here is a quick infographic I put together!  It took me roughly 15 minutes to go from the template I chose to my end result. (*Graphics will enlarge if you click on them)

Test

This is the end result of my testing!

Template

This is a basic Easel.ly template


Loving the idea but struggling to make it work? Here is a quick video tutorial to help you get started!

Connected Standards:

*NETS*S: 1.d: Creativity and Innovation – Identify trends and forecast possibilities 

*NETS*S: 6.d: Technology Operations and Concepts – Transfer current knowledge to learning of new technologies

Website #2: Maps Exhibit

Tool: Maps Exhibit

Link: http://www.loc.gov/exhibits/maps/maps-exhibit.html

Sponsor: Library of Congress

What is it? This website addresses four different categories of map-making: geodesy, surveying, geographic information systems (GIS), and cartography.  It includes videos and maps from around 1760 to today.

This type of resource could be used in the classroom within a social studies unit exploring geography and maps.  Students–permitting they have been taught a background in safe Internet use–could be allowed to explore and select a specific map to research.  Their research could be used to create a paper or presentation. Biggest bonus? This website could easily be used in correlation to the Teacher’s Guide to Analyzing Maps worksheet, also created by the Library of Congress.

Connected Standards:

*NETS*S: 3.c: Evaluate and select information sources and digital tools based on the appropriateness to specific tasks.

*NETS*T: 3.dModel and facilitate effective use of current and emerging digital tools to locate, analyze, evaluate, and use information resources to support research and learning.

Website #1: DocsTeach

Tool: Docs Teach

Link: http://docsteach.org/activities , http://docsteach.org/documents

Sponsor: The National Archives

What is it? This website is broken into two different – but related – sites.

The first link is to “Docs Teach Activities,” which is a collection of authentic primary sources integrated into lesson plan made by teacher for teachers.

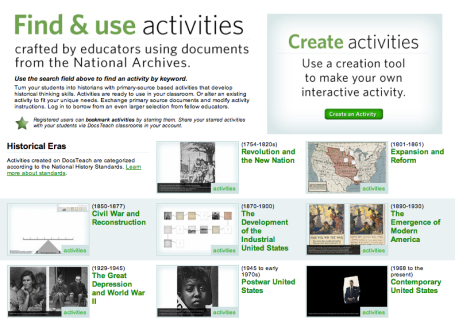
The second link is to “Docs Teach Documents,” which serves as an aggregator for primary sources to use in the classroom.  Both sides are easy to use, search, and utilize quickly in the classroom.  Biggest bonus?  Documents are sorted according to their corresponding National History Standards!

Tool #3: Map Fight

Tool: Map Fight

Link: http://mapfight.appspot.com

Cost: Free

What is it? While it appear initially plain, this tool allows students to have a “battle” between different geographic locations.  With its easy to use format, students select two different countries or U.S. state that they wish to compare the size of and click the Compare button.  The website will then provide a readout of two areas that including a comparison image, the area of each place in kilometers, and a size comparison (e.g., [Country x] is 54 times as big as [Country y]). This can help students better visualize the size of lands and provide data for mapping, history, or geographical projects.  The one Con I found was that advertising is prominently displayed directly underneath the read out.

Want to check one out? Here is a read out of the battle between the two countries I have lived in: